

Options Hedging Dynamics 101
Does this matter if I don't trade options? Absolutely. You'd be ignorant to ignore it.

Introduction/Purpose
This post is intended to give you a basic overview of how options trading affects the market itself. Options are mostly used as insurance to hedge or protect an investment. Here is where it gets interesting. If you decide to buy tornado or hurricane insurance, or even if EVERYONE in America decides to buy it at the same time, does that increase the probability of a hurricane making landfall? No it doesn’t. What if there is enough people buying put options to protect their long portfolio does it affect the underlying asset? Yes it does 100%.
If you own billions of dollars of AAPL stock, you might want to buy some downside protection right? You would do that by purchasing put options which pay if the price goes lower (roughly speaking). But who is selling these options? And if they sell the options, how do they hedge that risk? The people selling the majority of options are market makers/dealers and they hedge by actively trading in the underlying asset for which they are trading insurance on. I.E. buying enough downside protection can actually CAUSE a move lower. That’s how the tail (options) can wag the dog (the stock) in certain scenarios.
Who is this post meant for?
This post is NOT intended to be an introduction into what options are and how they work. There is a plethora of information on the internet that go into detail on the subject.
This post is intended for the trader or investor who has a working knowledge of what options are and how they work but not much more than that. The goal is to develop an intuitive understanding of the options landscape to drive more informed decision making in your area of expertise.
Why does this matter?
Why would we care about this? In certain conditions, we can glean incredible insight into the following questions:
What were market participants thinking in the past?
How that thinking has changed over time?
How much conviction did those participants have in their ideas?
What are participants currently thinking?
We also introduce the ability to forecast price movement (something commonly professed as impossible).
Furthermore, as we enter large options expiration (OPEX) cycles such as Sep 15, 2023 triple witching, dealer positioning becomes absolutely imperative to understand since some $600B worth of notional value will expire. This means there is potentially $600B worth of hedged assets that were previously bought or sold that might be unwound leading to large flows within the market. Flows that we can take advantage of. Like riding the wake behind a boat. Surfing the financial markets if you will.
Ok, so what do we want to know?
We want to try and answer these questions about the dealers.
Are they mostly long calls? Short puts? Long puts? Short calls?
Is it a lot or a little?
Will this hedging have any appreciable affect?
When is most of their exposure set to expire?
Where is most of their exposure at? Is it all at one spot or spread out evenly?
What happens when it expires? Anything?
What direction has that exposure been trending lately? Is it getting bigger or smaller?
To answer these questions I prefer to use the S&P 500 via the SPY and SPX. I’m also not looking for exact numbers, I’m looking for big picture/order of magnitude answers to the above.
Assumptions
Understanding the options landscape is unfortunately not an exact science (this is certainly by design). We will never know what is exactly on a market makers book. However, every single transaction in the market whether options, futures or stocks is recorded. This is recorded on a streaming wall of data known as time and sales (the tape). It tells us the asset, the time, the price, the quantity and most importantly, whether the transaction (or print) occurred at the bid, the ask or somewhere in between. It is publicly available and smarter people than me have figured out how to aggregate, analyze and sell this data. Now in order to parse the data to arrive at some reasonable conclusions we must make some basic assumptions.
We assume a transaction that is closer to the bid than the offer is selling. The distance from the mid point indicates how aggressive that sell was. If it prints on the bid, someone is willing to cross the spread and pay whatever someone is willing to buy at. If it’s slightly below the midpoint, someone was a little more included to sell than to wait and get filled at a higher price.
We assume a transaction that is closer to the offer is buying. Someone is willing to cross the spread and pay whatever someone is willing to sell at.
We assume that the vast majority of options transactions are between an options market maker and a trader (not trader to trader). This has been proven to be correct to a scary amount.
We assume that most of the notional value in trades are expressed through options rather than the underlying stock (see thought experiment below). We know the volume of options has exploded in recent years according to CBOE. Think about it, if 90% of every share of AAPL is owned by long term pensions and funds then that means they probably aren’t actively buying and selling. Those shares are locked away.
We assume that options dealers are always risk neutral (this is generally the case but we know they are willing to accept directional risk in order to increase profits if its within their risk tolerance). This means they are constantly hedging via high frequency trading.
What is dealer positioning?
Nearly all options activity takes places between you and an options market maker/dealer. They provide tight bid/ask spreads and liquidity. Want some obscure call on a stock with no volume? They’ll sell it to you if there are no standing orders at your exact price or better by another trader (there almost never is). They profit by making money on the spread. They do this on thousands of stocks, across thousands of strikes, across thousands of expirations. They use software to boil it down to some simple variables that allow them to monitor their position (option greeks). As I mentioned above, knowing how they are positioned could be valuable information.
Some Options Basics
In order to understand option dealer positioning and hedging, you must first know some basics about how options are valued. In short, they are priced using a partial differential equation known as the Black-Scholes equation shown below.
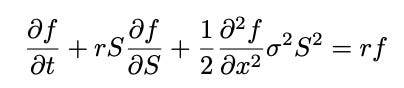
Don’t worry, you don’t need a math minor to understand how it works. I’m going to walk you through the concepts that matters. While there are 1st, 2nd and 3rd order derivates at play, for the scope of this post we’ll learn about the important ones:
Delta
Gamma
Vanna
Charm
It’s also worth noting that you can arrive at the same end result using simple binomial tree methods. @KrisAbdelmessih has a wonderful post that allowed me to cut my teeth into it with python.
What is delta?
Delta measures how much the value of your option will change for every $1 change in the underlying asset. Delta is always a number between 0 and 1. It can be positive or negative.
A delta of 0 means the option’s value won’t change no matter what the stock does (super deep out the money options - OTM yolos like buying a GME $500 call when its at $50).
A delta of 0.5 means your options contract will increase $0.50 for every $1 change in the asset. Delta is always 0.50 when the underlying asset price is equal to your strike price (at the money).
A delta of 1 means it moves 1:1 with the stock (super deep in the money options). Like owning an AAPL $20 call when it’s at $200.
Calls have a positive delta while puts have a negative delta
Stock has a delta of +1 if you are long or -1 if you are short (always 1).
Recall that 1 option contract is for 100 shares. So an options contract with a delta of +0.3 means a total delta of 0.3 * 100 = 30.
What is Gamma?
Gamma is a second order derivative of delta that denotes the rate of change of delta for a 1 pt move in the underlying. If delta were velocity, gamma is acceleration.
Gamma is at its highest when an option is at the money and is at its lowest when it is further away from the money.
Gamma is also highest for options closer to expiration than farther-dated ones, all else equal.
Gamma is used when trying to gauge how movements in the underlying asset will affect an option's moneyness.
Delta-gamma hedging immunizes an options position against moves in the underlying asset.
What is Vanna?
Vanna is a second order derivative of delta that denotes the rate of change of delta for a 1pt change in implied volatility.
Vanna is positive for call options and negative for put options.
What is Charm?
Charm is a second order derivative of delta that denotes the rate of change of delta for the passage of time.
Charm, or delta decay, measures the change in an option's delta as time passes, all else being equal.
Charm values range from -1.0 to +1.0, with in-the-money options tending toward 100 delta and out-of-the-money options toward zero as expiration approaches.
Options traders take note of their position's charm in order to maintain delta neutral hedging as time passes, even if the underlying stays put.
Dealer Hedging of Complex Portfolios
So how do dealers manage to stay risk neutral across thousands of positions trading thousands of times a second while the underlying assets are constantly changing at various rates? How do they perform a what-if analysis or evaluate tail risk conditions?
They calculate their total delta, gamma, vanna, and charm exposure across every position on their book and use high frequency trading algorithms to dynamically hedge thousands of times per second.
Hedging Dynamics
If you buy a call options from a dealer, then you want the price to go up to make money. If this happens though, the dealer loses money (and we both know they aren’t in the biz to lose money). So to hedge that risk, they buy underlying stock such that they are risk neutral. Price goes up, they lose on the call but make money on the stock. But how much should they buy? Depends on delta. Let’s walk through some examples of how trying to be risk neutral can stifle or expand volatility.
Example: How to hedge a long call option
If I buy 1 call option with a delta of 0.30 my delta exposure is +30 per contract. I would need to sell (or short) 30 shares of the underlying asset to be delta/risk neutral (30-30=0).
If the price goes up, delta becomes increasingly positive. Let’s assume it goes to 0.45. Now I would need to sell 15 more shares to be delta neutral (45-45=0).
If the price goes down, delta decreases. Let’s assume it goes to 20. Now I would need to buy 10 shares to stay delta neutral (+20-20=0).
Example: How to hedge a long put option
If I buy 1 put option with a delta of -0.30 my delta exposure is -30 per contract. I would need to buy 30 shares of the stock to be delta neutral (-30+30=0).
If the price goes down, delta becomes increasingly negative. Let’s assume it goes to -0.45 (-45 per contract). Now I would need to buy 15 more shares of the stock to be delta neutral (-45+45=0).
If the prices goes up, delta becomes less negative. Let’s assume it goes to -0.2. I would need to sell 10 shares.
Example: How to hedge a short call option
If I sell 1 call option with a delta value of +0.30 my total delta exposure would be -30 per contract (my delta is negative since I sold a + delta). To be delta neutral I would buy 30 shares of the stock to have a total delta of 0.
If the stock price goes up, delta increases meaning my delta exposure becomes more negative. Let’s assume it goes to +0.45 (my exposure is -45 per contract). Now I need to buy 15 more shares to have 45 shares total. Now I’m delta (and risk) neutral once again (-45+45=0).
If the prices goes down, delta decreases meaning my delta exposure becomes less negative. Let’s assume it drops to +0.20 (my exposure is -20 per contract). Now I need to sell 10 shares to have 20 shares total. Now my delta is -20+20=0.
Example: How to hedge a short put options
If I sell 1 put option with a delta value of -0.30 my total delta exposure would be +30 per contract. To be delta neutral I would have to sell or short 30 shares to be delta neutral.
If the price goes down, delta of the contract increases as it gets closer to the money. This means my exposure grows. Let’s assume it goes to -0.45 (my exposure is 45 per contract). Now I need to sell or short 15 more shares to stay delta neutral. Now my total short position is 45 shares against a short put option with a delta of -0.45.
If the price goes up, delta of the contract decreases. Let’s assume it falls to -0.20 (my exposure is now +20 per contract). To be delta neutral I need to buy or cover 10 shares.
Suppressing vs Expanding Volatility
Notice how when I bought (or went long) an option whether it was a call or put, I sold the stock the more it went up and bought it the more if goes down. I am trading against the trend.
When I sold (or shorted) an option whether it was a call or put, I bought the stock the more it went up and sold the stock the more it went down. I am trading with the trend.
This is how financial flows develop. It’s these hedging flows than can create opportunities for profit.
Thought Experiment
What if you could only trade options and the only people allowed to buy and sell stock where the option dealers and major wall street institutions like BlackRock, Vanguard, State Street, etc. Pretend stocks were only available to those on Wall Street.
Let’s go with this thought and pretend there are rumors that Apple is coming out with a massively positive quarterly earnings report. AAPL is at $184 on a Monday and we saw the vast majority of traders were buying the $200 call expiring that Friday (earnings are that Thursday after close).
For simplicity let’s assume thats the only option being purchased was the $200 call expiring that week. Dealers who sell those calls buy the underlying stock to hedge that risk. This causes the stock price to rise which in turn increases the value of said calls and creates more reflexive buying. But what happens when the price gets to $200 from the dealer hedging? If the only reason the stock is up in the first place is from dealers selling calls, then now what?
Well, if AAPL has a better than expected earnings and the “pros” come in and buy a ton of stock, the dealers are in for some pain. If the price goes higher than $200 they lose money and must buy more of the underlying asset to offset their losses.
What if the earnings are a total disappointment and the street starts dumping shares? Well now the price falls, the calls lose value and so regular joe traders start selling their calls at a loss. The dynamic hedging algorithms begin selling what they previously purchased as a hedge which in turns suppresses the price.
Recall from above when someone sells or shorts an option, they trade WITH the direction of the market. They buy rips and sell dips. This reflexivity is what led to GameStop (GME), AMC, MRNA, NVDA, TSLA and other names going parabolic.
Pro tip: ever wonder why stocks go wild in after hours but then seem to come to a dead stop out of nowhere? The price it stabilizes at is likely where most options exposure is.
In Summary: Delta & Gamma Exposure
Positive Delta: Dealers are either long calls or short puts. This is a bullish holding on their books meaning a bearish view by everyone else.
Negative Delta: Dealers are either long puts or short calls. This is a bearish holding on their books meaning a bullish view by everyone else.
Positive Gamma: Dealers are net LONG options meaning traders have been selling more options than buying them.
Negative Gamma: Dealers are net SHORT options meaning traders have been buying more options than selling them.
Phew, that was a lot. I understand it but how do I do this?
For starters get prepared to pay a non trivial amount of money each month for specialized data aggregators. Otherwise, learn to code and take the free data from CBOE and do it on your own (I’m working on this myself using Python). In the meantime, I pay hundreds a month to have third party data.
Remember those assumptions above? They have a dramatic affect on how you interpret the data. That’s why I use multiple data aggregators who use slight variations on those assumptions and use different black box models. This gives me a more comprehensive view of the data. For simplicity sake, I’ll show some charts from one of the providers called Tradytics. SpotGamma is another tremendous resource. Brent’s morning and evening notes provide great insight and their HIRO tool is amazing. No I’m not affiliated with them but if Brent is reading this a discount would be nice :)
Let’s do it! Dealer positioning analysis for week ending September 8th, 2023.
The first chart shows the estimated delta exposure of options dealers each day for the S&P 500 ETF (SPY). The green and red bars are the delta readings against the scale on the right. The white line is the price of the SPY measured against the left scale.
A positive reading implies they hold a bullish position which could either be long calls or short puts. Both profit if the underling asset goes up. From this chart we can notice dealer deltas went from 0.8 to nearly 0 recently but they are still positive meaning they hold a bullish position on their books.

The second chart below shows the estimated gamma exposure of options dealers. Remember gamma is the second order derivative of delta. This shows dealers are positive gamma meaning they are net long options.

Put it together with the charts above and we can deduce that dealers are currently long calls as of Friday September 8th. So what does that mean? It means traders are mostly short calls at the moment. This implies that most market participants are slightly bearish on the market at the moment.
How has sentiment shifted recently?
Notice in the weeks leading up to now however, dealers went from extremely +delta/-gamma to slightly opposite. This means they were short a lot of puts (traders were buying puts) at the peak on Aug 18th where delta is +0.8.
Since August 18th, dealers short gamma exposure has only decreased while deltas also decreased. I.E. dealers were short a ton of puts (traders were long a lot of puts) but have since become less and less short puts (traders have sold puts taking profits).
So if you’re a dealer selling puts and prices move lower as they did into Aug 18, you must continue to short the underlying. This makes sense as markets moved lower into the Aug 18 monthly opex since delta hedging (and 2nd order derivatives) can grow or decrease exponentially as we approached expiration.
So what happened after Aug 18 OPEX? Dealers were left with a large short position but no need for it unless traders kept buying more puts at the same level or more. Instead, most traders expected a bounce after being so far extended down so there was no significant put buying. This is why we ripped the following Monday - Wednesday. Not because people were really buying the dip, but because dealers had a large short position to cover while still having negative gamma exposure. So if you buy to cover with -ve gamma, then you buy as the price goes up. But market makers aren’t dumb. They were net short the underlying. Wouldn’t they want to try and cover lower than their cost basis to make a profit on the underlying? If they bid prices too high they could end up losing on their underlying. So they drop the bid, chasers get dumped on and then they resume their hedge unwind (in this case unwinding their hedge meant buying).

So we know dealers were taking on large short put positions and shorting the market lower to hedge. Traders like me who bought puts ahead of time began monetizing their put options which decreased dealer exposure allowing them to cover.
Wait what about Vanna and Charm?
You can also find similar charts for dealer vanna and charm. They help identify how quickly delta hedging can change due to changes in IV and time. For this post, delta/gamma is sufficient.
Now what?
We appear to be in yet another Mexican standoff. Where neither delta nor gamma is extremely strong. This is not surprising as we head into such a large OPEX next week that is also triple witching. I believe much of this recent action was planning ahead of dealers to minimize the size of their hedge as we approach a volatile week with CPI, PPI and Fed Interest Rate Announcement. Imagine they were still short a TON of stock and we had a surprise rate pause. They would be forced to cover an ENORMOUS amount of stock in an extremely short amount of time, almost certainly losing money in the process.
This is why we see so much pinning into major OPEX cycles. Knowing this, one could decide to bet on a pin by selling strangles for example.
My plan is wait for the PPI, CPI prints and see how dealer positioning changes for clues into what participants think.
Conclusion
If you have to re-read this many times, rest assured that you are not alone. It’s taken me over a year of dedicated study to be able to parse the data rapidly and interpret it intuitively. Keep in mind, this was an introductory overview. Don’t get me started on the more advanced aspects! Hell I wrote this in a Sunday afternoon. Oh wait, that just makes me a nerd.

I hope you at least learned that the market is much more complex than you imagined and that a simple concept such as supply and demand can be represented through extremely complex mechanisms.
Cheers!
-Josh